Custom Log-based Alerting using Azure Data Explorer and Log Analytics Data Export
Azure Monitor is a multi-tenant service which serves thousands of organizations and therefore processing times will vary depending on multiple factors outside of the organizations' control.

Azure Monitor is a powerful service which allows developer and operations teams to gain crucial insights into the health of their solutions which are deployed to the Azure Cloud, some of the core capabilities provided by Azure Monitor are:
- Infrastructure Monitoring (Virtual Machines, Containers & other Azure resources).
- Application Performance Monitoring(APM) leveraging Azure Application Insights.
- Dashboarding, Complex Visualizations, Querying and Alerting.
When talking about latency with regards to Azure Monitor it's important to define the types of monitoring data we are working with:
- Metric Data - Numerical data that is collected at a specific point in time and describes the state of the system, this type of data is typically fast to process and is available almost immediately once it is ingested.
- Log Data - Semi-structured data which is organized into records containing properties with different data types, due to the complexity of processing semi-structured log data this type of data is usually more expensive to process and takes longer to become available for querying once ingested.
In this scenario when considering potential End-2-End latency for monitoring data ingestion & querying we need to keep the following points in mind:
- Time it takes for the Monitoring Agents to collect the data - This can vary by data type, monitoring agent and azure resource provider. Another factor is upload frequency, as for performance reasons the agent buffers data locally and uploads once buffer is full.
- The total time it takes for data to pass through the Ingestion Pipeline once it hits the Ingestion service.
- And finally, the time it takes for log analytics to index the data.
According to the official Azure documentation - "The typical latency to ingest log data is between 20 sec and 3 minutes.". Azure Monitor is a multi-tenant service which serves thousands of organizations and therefore processing times will vary depending on multiple factors outside of the organizations' control.
One key scenario for leveraging the collected monitoring data is for triggering Azure Alerts when certain conditions are met - Keep in mind that these conditions can only be evaluated once the data is ingested and is available for querying. Leveraging Metrics Alerting today you can trigger an alert in under 5 minutes leveraging a 1-minute frequency, up until recently this was not available for Log Alerting - But recently this feature has been made available in preview.
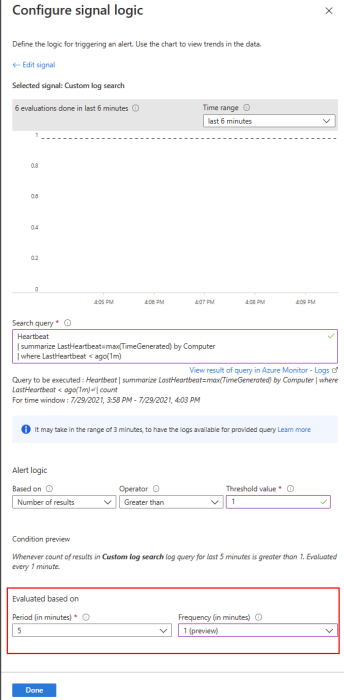
With this new capability for Log Alerting, we could also potentially trigger a log alert in under 5min using a 1-minute frequency, in addition to this if we consider that it may take up to 3 minutes for the log data to be ingested before being queryable. This could could potentially translate into total latency of +- 8minutes from ingestion to alert (excludes agent collection time). In most organizations this is perfectly acceptable and therefore the built-in capabilities are sufficient.
So why would we want to combine Azure Log Analytics and Azure Data Explorer, well let's look at some pro's & cons:
Pros
- Possible to achieve under 30-second latency from ingestion to alert (excludes agent collection time)
- Dedicated Cluster with multiple compute SKU's available
Cons
- Additional resource costs
- Additional complexity for setup and operation of the solution
Streaming Monitoring Events to Azure Data Explorer
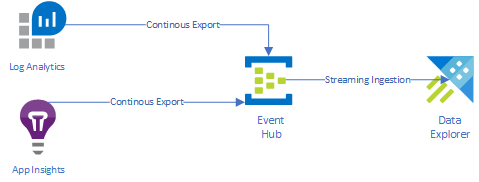
For the rest of this post, we will focus on configuring our scenario for streaming Azure Monitor data to Azure Data Explorer via Azure Event Hub. We have multiple options for streaming telemetry data:
- If the target resource supports it, we can directly configure telemetry Ingestion via EventHub using Diagnostic Settings for each individual resource.
- Leverage the existing Azure Monitor Ingestion Pipeline:
- Use Log Analytics Workspace Data Export(PREVIEW) to ingest telemetry via our Event Hub, in this case we are able to hook early into the Azure Monitor (LAWS) ingestion pipeline to forward data to ADX. Something to keep in mind is that not all Log Analytics tables are currently supported, therefore this solution may not be suitable for all scenarios.
- We can combine this with AppInsights Data Export to also setup ingestion of Application telemetry.
My focus in this post will be to leverage the continuous export functionality provided by Azure Monitor, at a high level I am looking to configure the following:
To complete the steps below you will require the following resources created up front:
- Create a Azure Log Analytics Workspace
- Create a Azure Data Explorer Cluster
- Create a Azure Event Hub Namespace
We will be basing our solution in part on the following tutorial published by the Azure team.
Prepare the Azure Data Explorer Cluster
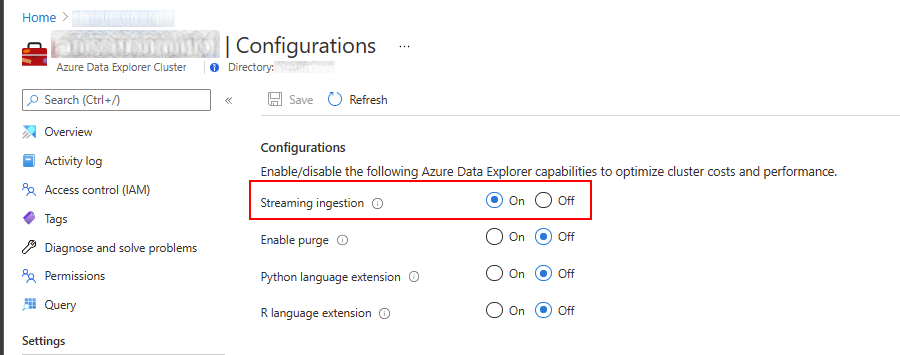
1.Enable Streaming Ingestion for your existing cluster or at cluster creation time, this allows ADX to ingest incoming data almost immediately. This can be done on an existing cluster in the Azure Portal->Azure Data Explorer Cluster Resource->Configuration.
2. Create a new database, give it a name which represents your data.
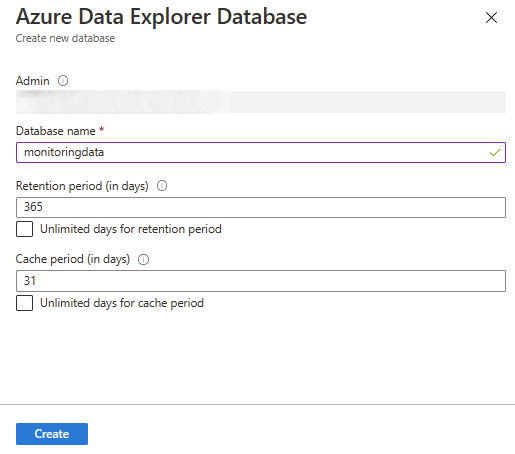
3. Create a new table in your database for staging incoming raw data and enable the streaming ingestion policy for this table, for simplicity I have chosen the Heartbeat table. The reason we need this staging table is that the json payload for incoming data will contain multiple records, we store this temporarily in its raw format before we expand and project this data into the destination table.
.create table HeartbeatRawRecords (Records:dynamic, EventHubEnqueuedTime: datetime)

.alter-merge table HeartbeatRawRecords policy retention softdelete = 0d

.alter table HeartbeatRawRecords policy streamingingestion enable
4. Create JSON mapping between the incoming JSON Payload and our staging table properties
.create table HeartbeatRawRecords ingestion json mapping 'HeartbeatRawRecordsMapping' '[{"column":"Records","Properties":{"path":"$.records"}},{"column":"EventHubEnqueuedTime","Properties":{"Path":"$.x-opt-enqueued-time"}}]'
5. Create a table to store the data once it has been through the staging process
.create table Heartbeat (TenantId: string, SourceSystem:string, TimeGenerated: datetime, SourceComputerId:string, ComputerIP: string, Computer: string, OSType: string, OSName: string, OSMajorVersion: int, OSMinorVersion: int, ResourceId: string, EventHubEnqueuedTime: datetime)

.alter table Heartbeat policy streamingingestion enable
6. Create a function to expand and project the raw data into the destination table, properties and data types should match the table schema above.
.create function HeartbeatExpand() {
   HeartbeatRawRecords
   | mv-expand events = Records
   | where isnotempty(events.Computer)
   | project
        TenantId = tostring(events['TenantId']),
        SourceSystem = tostring(events['SourceSystem']),
        TimeGenerated = todatetime(events['TimeGenerated']),
        SourceComputer = tostring(events['SourceComputer']),
        ComputerIP = tostring(events['ComputerIP']),
        Computer = tostring(events['Computer']),
        OSType = tostring(events['OSType']),
        OSName = tostring(events['OSName']),
        OSMajorVersion = toint(events['OSMajorVersion']),
        OSMinorVersion = toint(events['OSMinorVersion']),
        ResourceId = tostring(events['_ResourceId']),
        EventHubEnqueuedTime
}
7. Configure an Update Policy on the destination table to trigger our expansion function when raw data is ingested into the source table.
.alter table Heartbeat policy update @'[{"Source": "HeartbeatRawRecords", "Query": "HeartbeatExpand()", "IsEnabled": "True", "IsTransactional": true]'
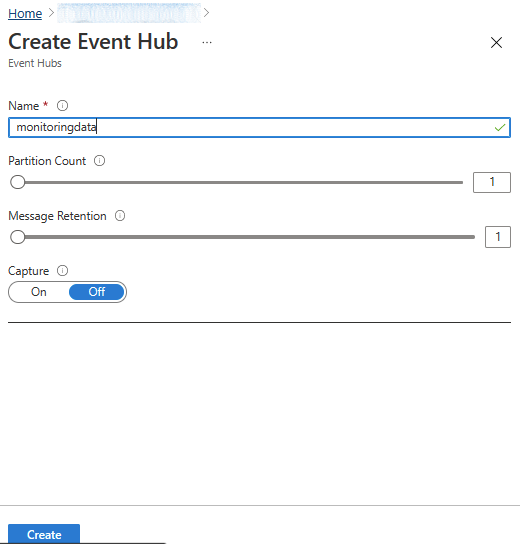
Prepare the Azure Event Hub
We will be streaming events via Azure Event Hub therefore we will need to create a new Event Hub in your existing namespace.
The official documentation for the Data Export functionality provides some additional considerations which we should take into account when correctly sizing our Event Hub Namespace:
- The 'Basic' event hub SKU supports a lower event size limit and some logs in your workspace can exceed it and be dropped. We recommend using a 'Standard' or 'Dedicated' event hub as an export destination.
- The volume of exported data often increases over time, and the event hub scale needs to be increased to handle larger transfer rates and avoid throttling scenarios and data latency. You should use the auto-inflate feature of Event Hubs to automatically scale up and increase the number of throughput units to meet usage needs.
Connect Azure Event Hub to Azure Data Explorer
Once our Event Hub is created we can move on to connecting it with our ADX cluster, this can be done via PowerShell or the Azure Portal UI.
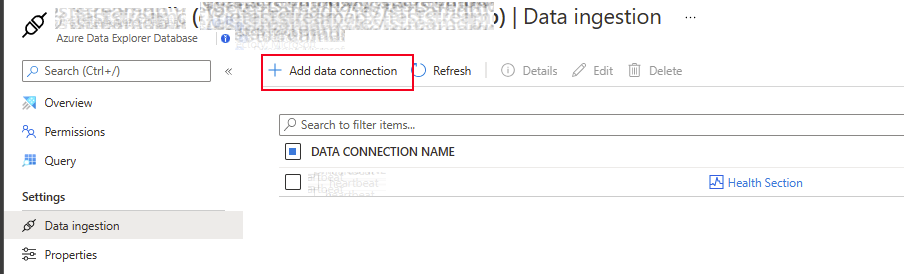
- Open the Azure Data Explorer Cluster resource blade in the Azure Portal and go to Databases->[Your Database name]
- Under Database Settings select Data Ingestion and click Add data connection
3. Supply the details for the Data connection leverging the details we used in preceeding steps.
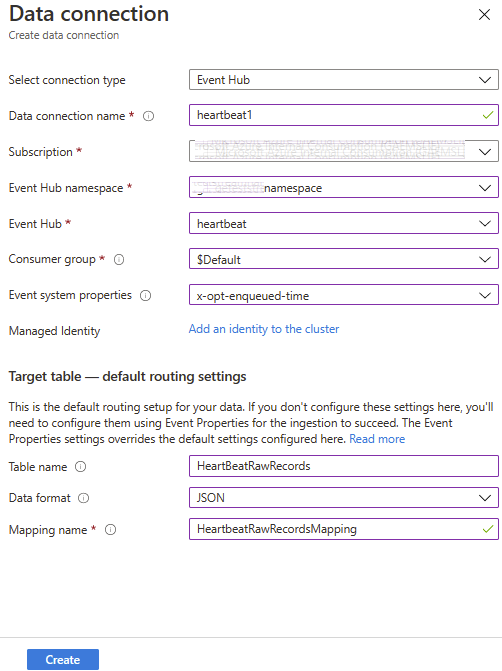
We should start to see records appear in our HeartBeat table after a few minutes.
Configuring Custom Notifications & Alerting
There are multiple options for alerting on Kusto queries against your Azure Data Explorer Data:
- Directly poll the data from your notification & alerting process, depending on the query complexity and amount of data there may be additional latency introduced.
- Use Update Policy to define notification rules based on inbound streaming data and output a record to a notification table. We can then then poll a much smaller dataset which will be extremely fast. one limitation of this method is the following - "The update policy query is run in a special mode, in which it's automatically scoped to cover only the newly ingested records, and you can't query the source table's already-ingested data as part of this query."
Its likely that organizations would leverage a combination of the two strategies described above, polling of ADX data can be performed using Azure Logic Apps , Grafana integration and/or via custom applications leveraging the ADX SDK's.
In the diagram below we can see the high level process including the additional notification steps.
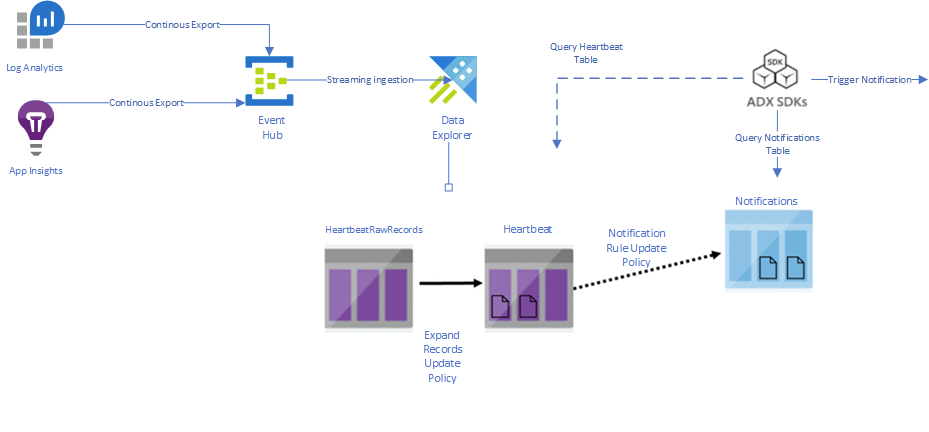
Lets setup a simple notification rule and demonstrate how we can trigger a custom alert using Logic Apps:
- Create the Notification and Notified Tables which will be used to to trigger alerts and report on success.
.create table Notification (NotificationId: guid, NotificationQueueTime:datetime, Message: string)

.alter-merge table Notification policy retention softdelete = 7d

.create table Notified (NotificationId: guid, NotificationSentTime:datetime, Success: bool)

.alter-merge table Notified policy retention softdelete = 7d
2. For purposes of demonstration we will setup a contrived scenario based on our incoming Heartbeat data. We will look for versions of Ubuntu which are not supported by our organization. The Update Policy for this Notification Rule would look something like the following:
.create function HeartbeatUbuntuVersionNotificationRule() {
Heartbeat
| where OSName == "Ubuntu"
| summarize LatestOSVersion=max(toreal(strcat(OSMajorVersion,'.', OSMinorVersion))) by Computer
| where LatestOSVersion <= 18.4
| project
    NotificationId = new_guid(),
    NotificationQueueTime = now(),
    Message = strcat(Computer," using unsupported version of Ubuntu.")
}

.alter table Notification policy update @'[{"Source": "Heartbeat", "Query": "HeartbeatUbuntuVersionNotificationRule()", "IsEnabled": "True", "IsTransactional": true}]'
3. Follow the steps outlined here to create a Logic App or replicate the workflow in Power Automate to poll our notifications table and send an email once new records are added.
4. Navigate to https://flow.microsoft.com, Search for "Kusto" Templates.
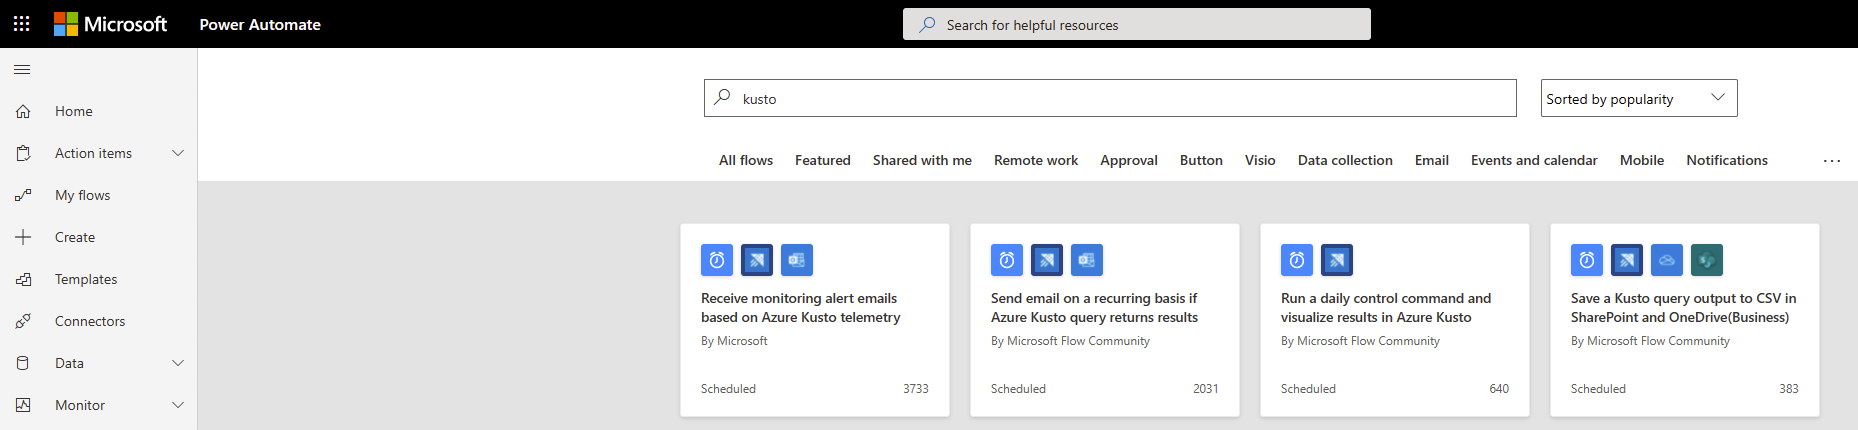
5. Create a new flow based on the "Receive monitoring alert emails based on Azure Kusto telemetry".
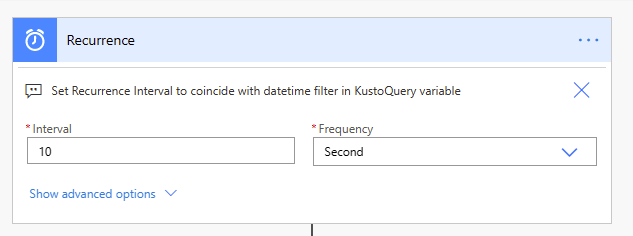
6. Set the desired time interval for the flow to be executed, for example every 10 seconds.
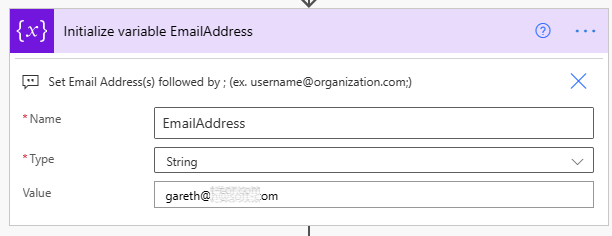
7. Set email address/s which should receieve the notifications
8. Provide the Kusto query which we will use to poll the Notifications Table, this query will trigger the notification if the generated NotificationId does not already exist in the Notified Table.
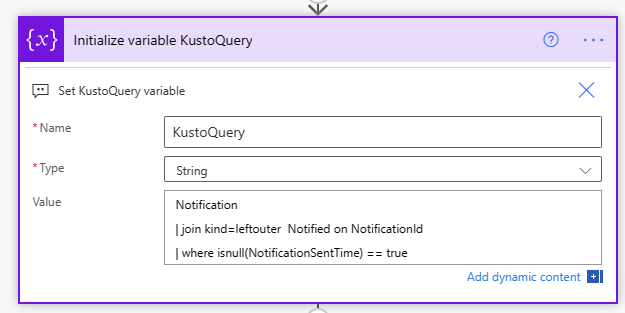
9. Set the Azure Data Explorer Cluster URI and the database name.
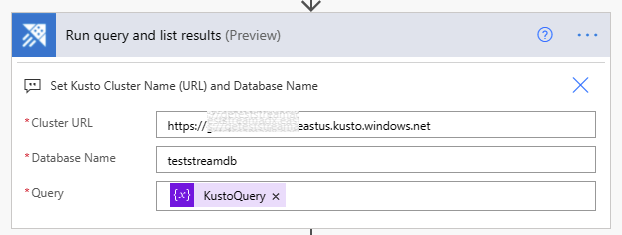
10. Test your Flow, you should start to receive emails, at this point we have not customized the contents of the email and are using the functionality defined in the provided Template.
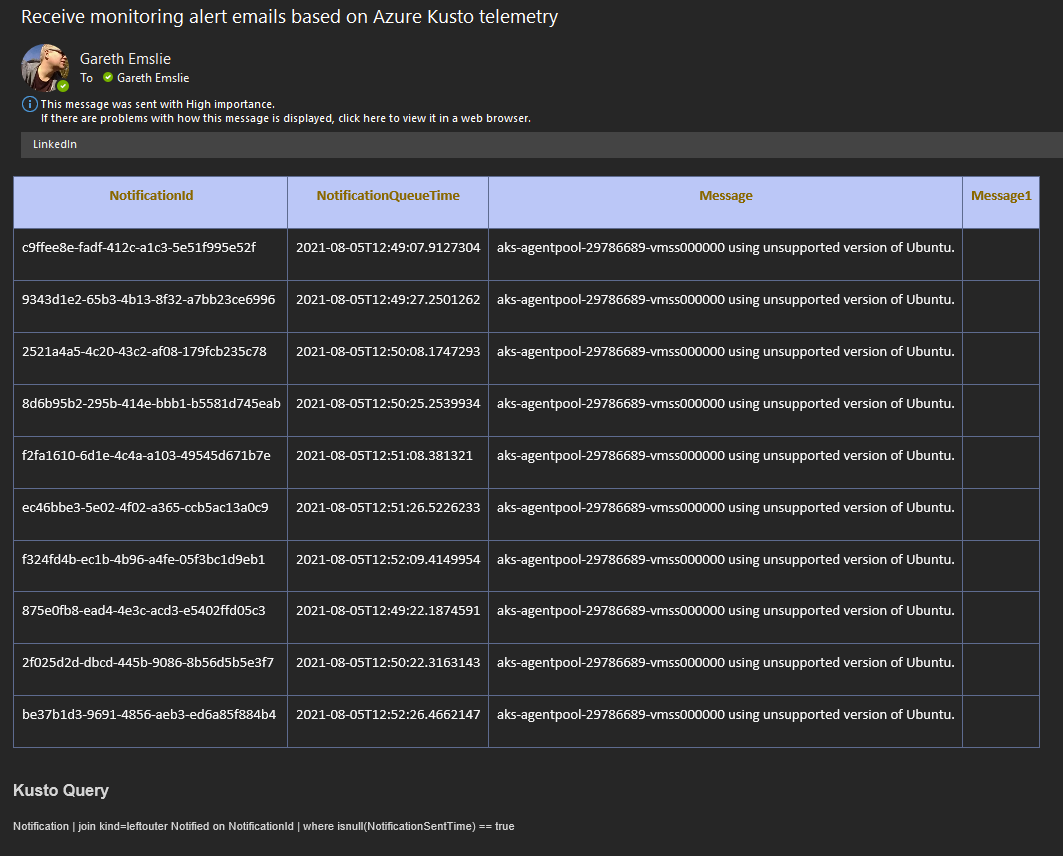
11. What we have also not done is add the actions to store the notification result in the Notified Table, this would then complete the notification process. I will look at how we can extend the flow in a subsequent blog post to do this. The basic idea would be to get the result of the Send Email Action and then to enumerate each of the rows returned by the kusto query above. For each row we would add a mathcing record to the Notified Table with the notification result. We could potentially do this via inline ingestion, but as I mentioned I will explore this at a later time.
.ingest inline into table Notified <|
NotificationId, now(), true | false
Latency from ingestion to triggering custom alert
After completing all the steps above do we actually see an improvemt on ingestion latency? There is a simple Kusto query which we can use to report on End-2-End Ingestion Latency. Lets run this on the data which has been ingested into our Azure Log Analytics Workspace.
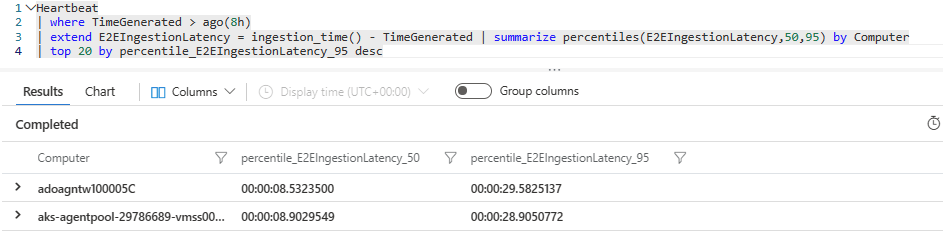
Now lets take a look at the reported ingestion latency for the data which has already been imported into our Azure Data Explorer table for the same period.
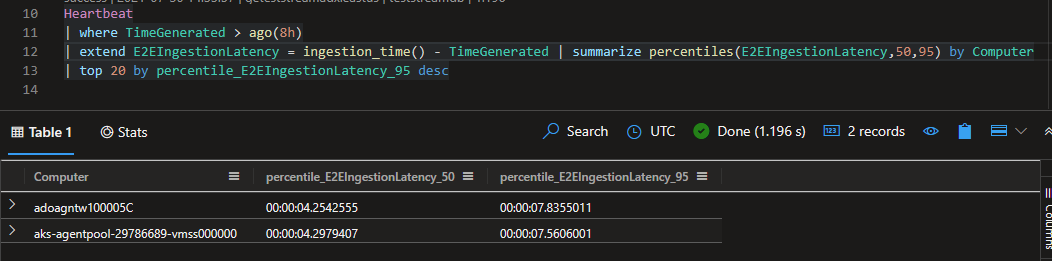
For our simple scenario we see a big difference and this is based on the fact that in our ADX scenario we are leveraging dedicated resources. The table below represents the data in slightly different manner to highlight the latency improvements.
| 50th percentile | 95th percentile | |
|---|---|---|
| LAWS | 00:00:08.5323500 | 00:00:29.5825137 |
| ADX | 00:00:04.2542555 | 00:00:07.8355011 |
| Delta | 00:00:04.2780945 | 00:00:21.7470126 |
Even if we add the +- 10 seconds which is incurred by logic apps for polling the ADX data we see above its possible to achieve under 30-second latency from ingestion to alert leveraging Azure Data Explorer.