💡
Attention readers! We want to let you know that the summaries in this newsletter are generated using cutting-edge generative AI technology. However, we understand the importance of accuracy and quality content, so our team of expert editors manually reviews each summary before it's published. If you feel the quality of a particular summary does not meet your expectations, please leave a comment in the Member Discussion section below. We will rectify it as soon as humanly possible!
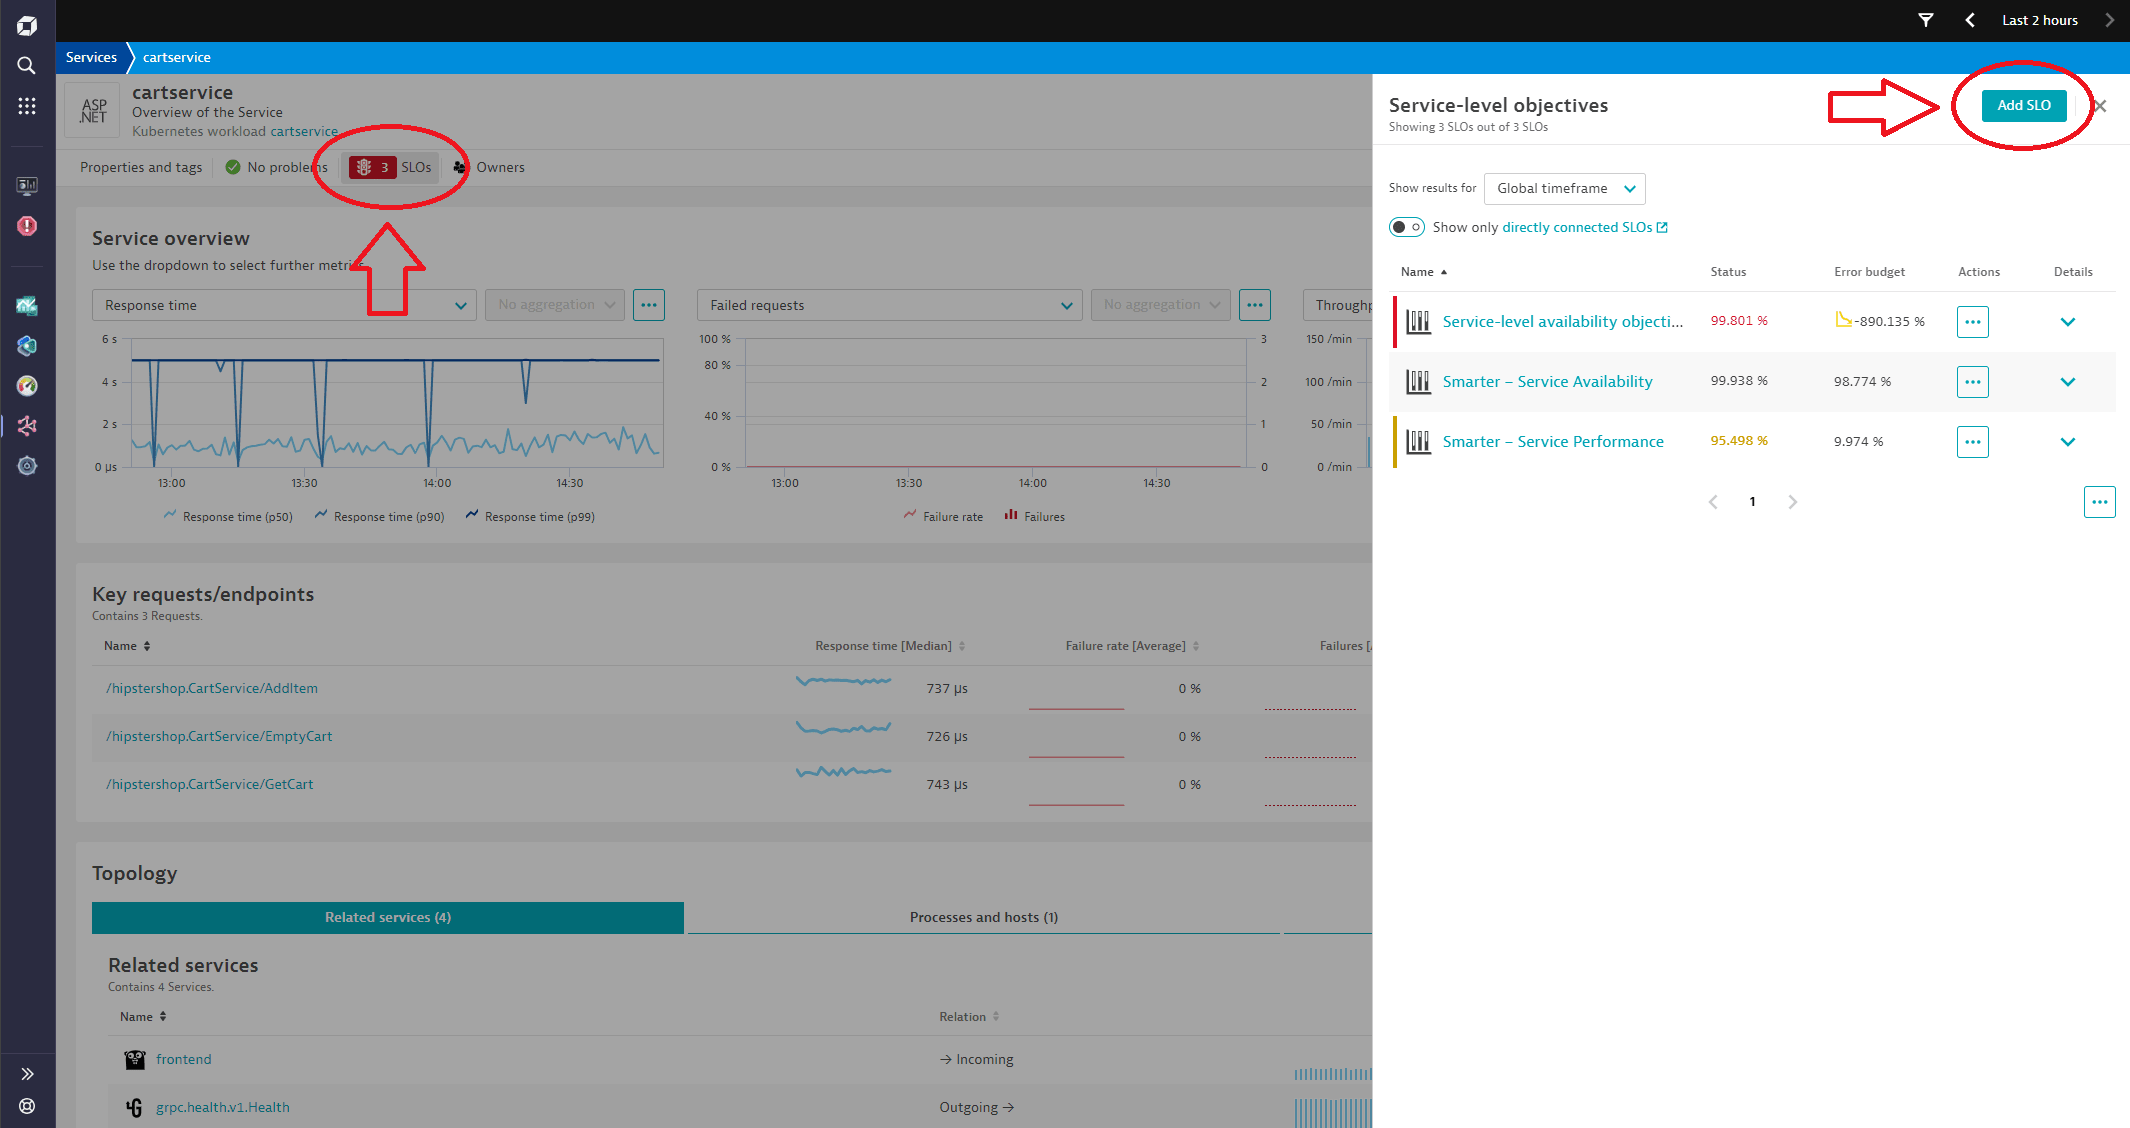
Maximize user experience with out-of-the-box service-performance SLOs
Microservice-based architectures offer flexibility, autonomy, and velocity but also increase system complexity. Monitoring service performance is crucial for business success, and service-level objectives (SLOs) are vital for setting and measuring service-quality targets. SLOs cover various monitoring options, including the four golden signals: latency, traffic, errors, and saturation. SLOs are based on service-level indicators (SLIs) and track performance against pre-defined service-level agreements (SLAs). Response times and latency are key indicators for defining and monitoring service-side objectives. Dynatrace provides templates for creating SLOs based on service performance, simplifying the process. The templates use metric expressions and transformations to calculate the SLO's service performance status. Custom-calculated metrics can be combined with built-in metrics for higher precision. SLOs can be set up and monitored using the SLO wizard and can be visualized on a dashboard. Resources are available for creating SLOs and achieving business goals.
#MicroserviceArchitectures #ServiceLevelObjectives #Dynatrace #softcorpremium
Best of breed observability with Spring Micrometer and Dynatrace
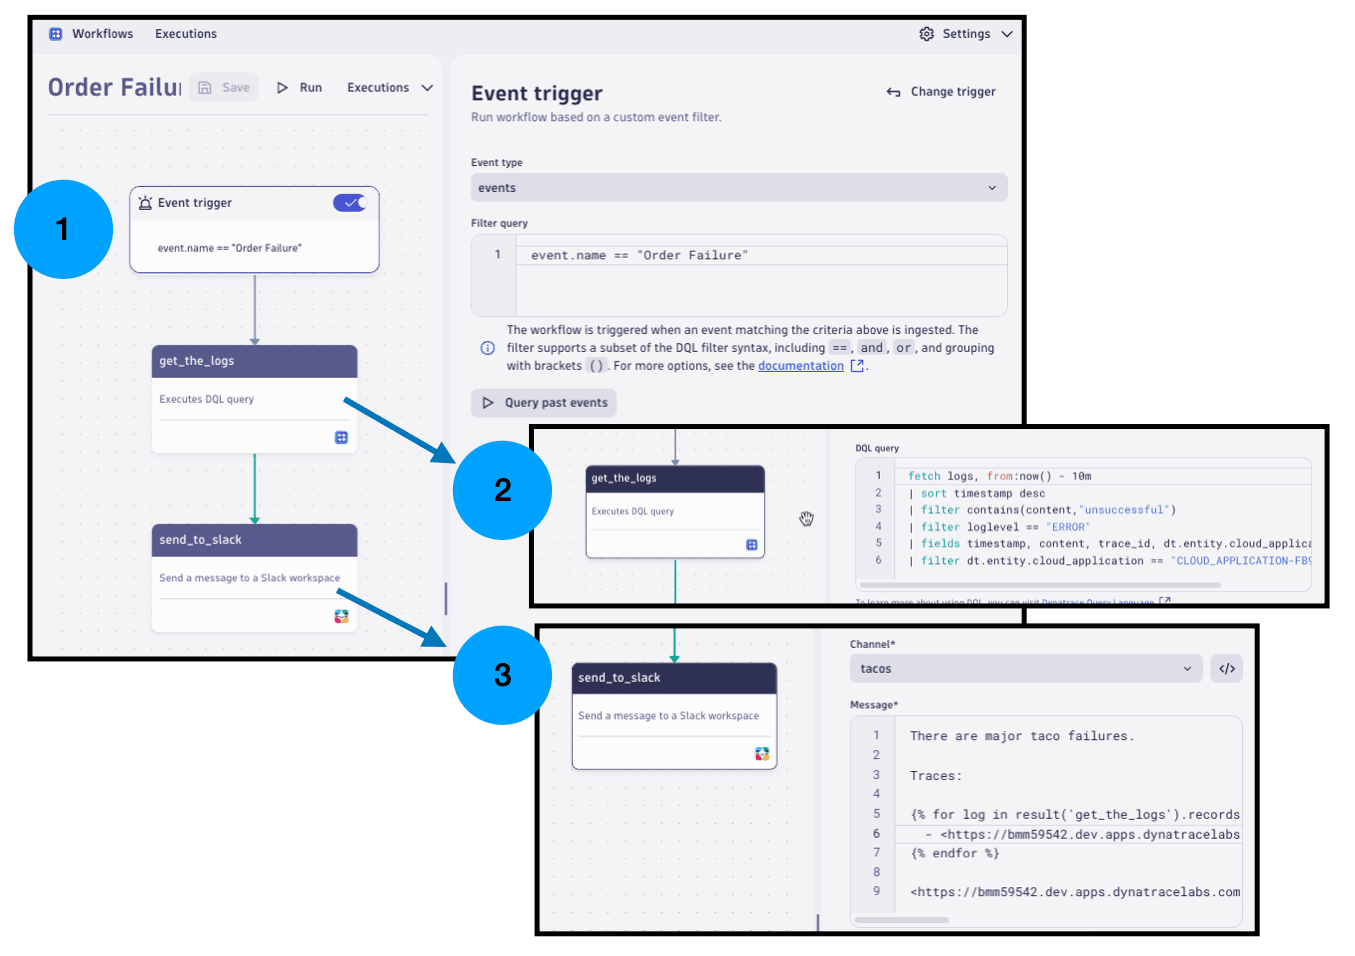
Dynatrace, a performance monitoring platform, has collaborated with the Spring Framework team to enhance their integration with Spring Micrometer. Dynatrace provides automatic metric enrichment, optimized data export, and unit and description metadata for Spring Micrometer users. By combining Spring Micrometer with Dynatrace OneAgent, users can benefit from distributed tracing, memory analysis, and garbage collector analysis. Dynatrace also offers auto-enrichment for Kubernetes deployments and the Dynatrace Operator for metadata management. The integration allows for unified analytics views, anomaly detection, and workflows with Slack integration. Dynatrace's Micrometer Registry is battle-tested and optimized for observability needs.
#DynatraceCollaboration #SpringMicrometerIntegration #ObservabilitySolutions #softcorpremium
Complete Kubernetes observability with logs in topology context
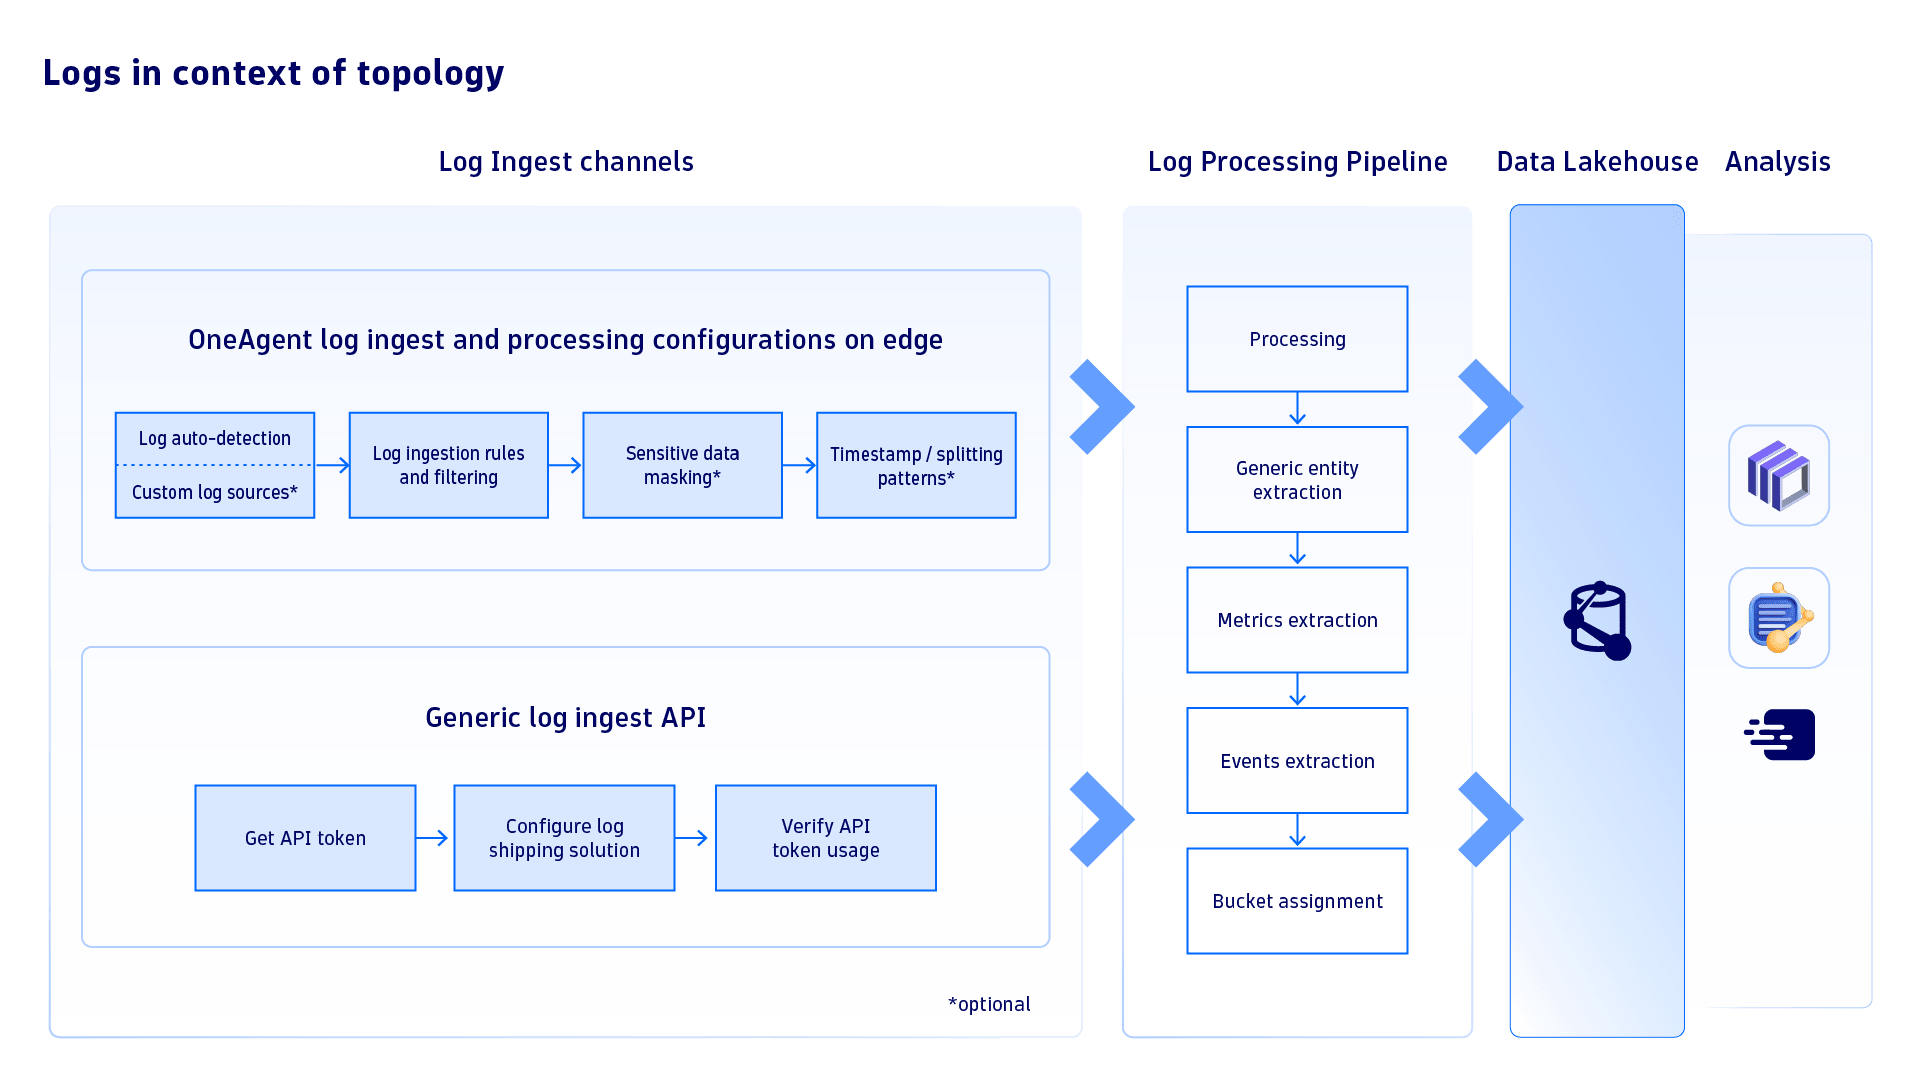
Dynatrace, an observability platform, has announced that its Log Management and Analytics feature can now maintain the complete context of Kubernetes architecture and platform logs. This allows for easier monitoring and troubleshooting of Kubernetes clusters and containers. By deploying the OneAgent daemon set using Dynatrace Operator, users can collect logs and gain complete observability within the context of their topology. Dynatrace OneAgent enhances these logs by including Kubernetes metadata, making it easier to link logs with entity models and improve overall infrastructure and workload observability. The platform also offers filtering options, log ingestion control, and integration with log shipping solutions. With out-of-the-box alerting and AI-powered troubleshooting capabilities, Dynatrace simplifies the process of identifying and resolving issues within Kubernetes workloads. The platform also provides powerful log analytics and the ability to link logs with traces and user sessions for end-to-end observability.
#observability #KubernetesLogs #Dynatrace #softcorpremium
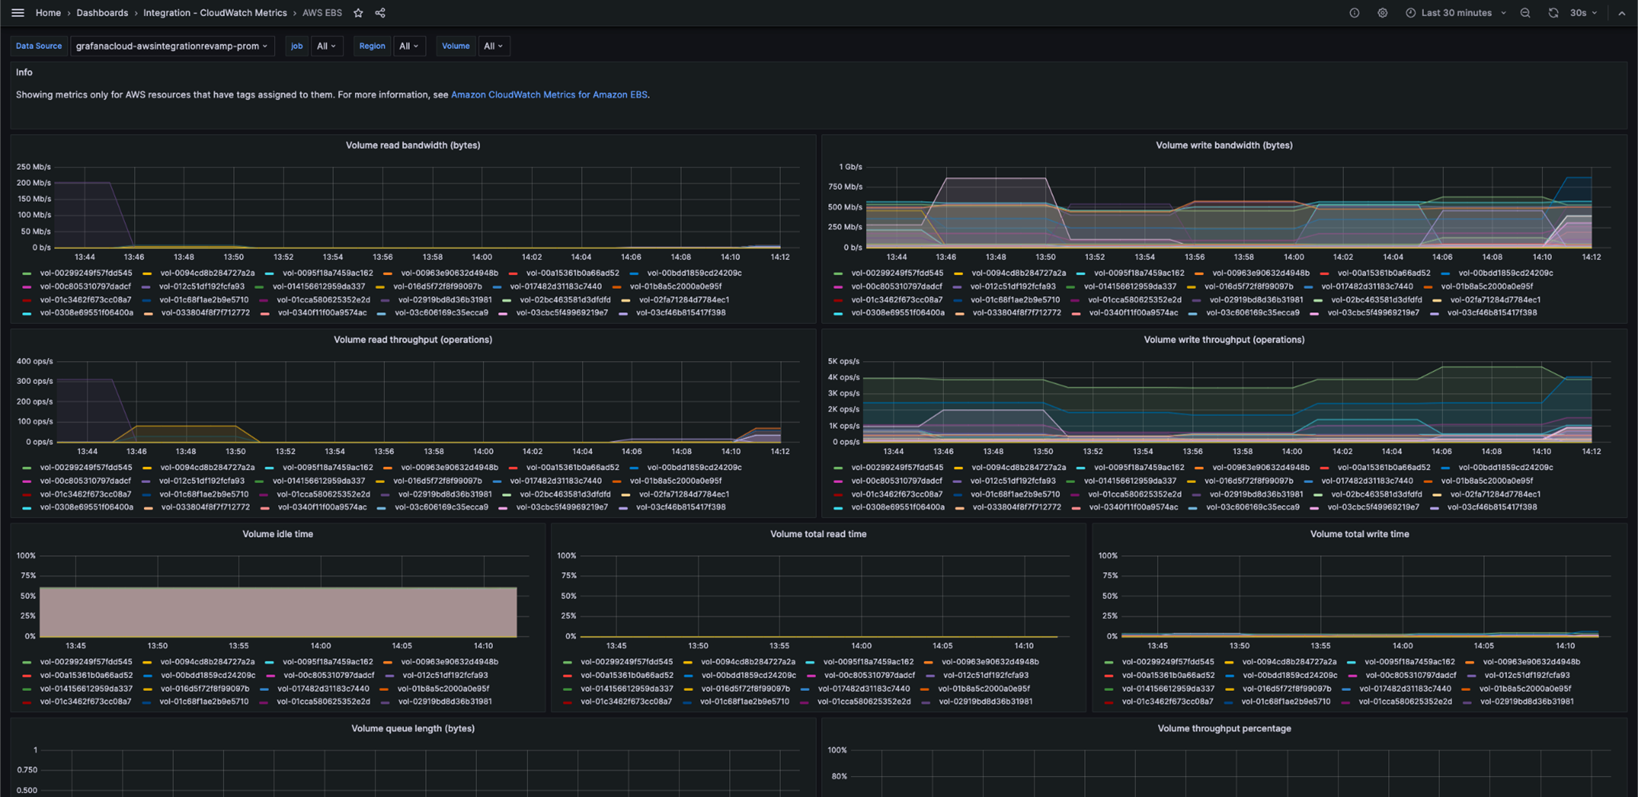
Centralized AWS Observability with Grafana Cloud for Monitoring, Analytics, and Optimization | AWS Partner Network (APN) Blog
Grafana Labs, in collaboration with AWS, has rolled out an updated AWS experience that allows users to monitor over 60 popular AWS services in Grafana Cloud. This integration helps organizations centralize their observability data, making it easier to troubleshoot issues. The new AWS integration offers benefits such as a growing catalog of services, simple configuration, and a scalable backend. Users can easily get started with the integration by signing up for a Grafana Cloud account and following a few simple steps. Grafana Labs plans to continue enhancing the AWS integrations to better understand usage and costs. Integrations are free across all tiers, and users only pay for data ingestion.
#GrafanaAWSIntegration #ObservabilityMadeEasy #AWSMonitoring #softcorpremium
Monitor your Databricks Clusters with AWS managed open-source Services | AWS Cloud Operations & Migrations Blog
The AWS Cloud Operations & Migrations Blog emphasizes the importance of monitoring Databricks clusters for optimal performance of Spark workloads. AWS offers managed open-source services such as Amazon Managed Service for Prometheus, AWS Distro for Open Telemetry, and Amazon Managed Grafana to seamlessly integrate with Databricks and provide comprehensive observability. The blog provides step-by-step instructions on setting up a Databricks workspace on AWS, including creating an AWS and Databricks account, configuring an AMP workspace, setting up an S3 bucket for initialization scripts, and configuring IAM roles. It also highlights the new features of Amazon Managed Grafana and the ability to import JSON files into dashboards. The article concludes with best practices for monitoring and maintaining Databricks clusters in AWS.
#AWSManagedServices #DatabricksMonitoring #ObservabilityInAWS #softcorpremium
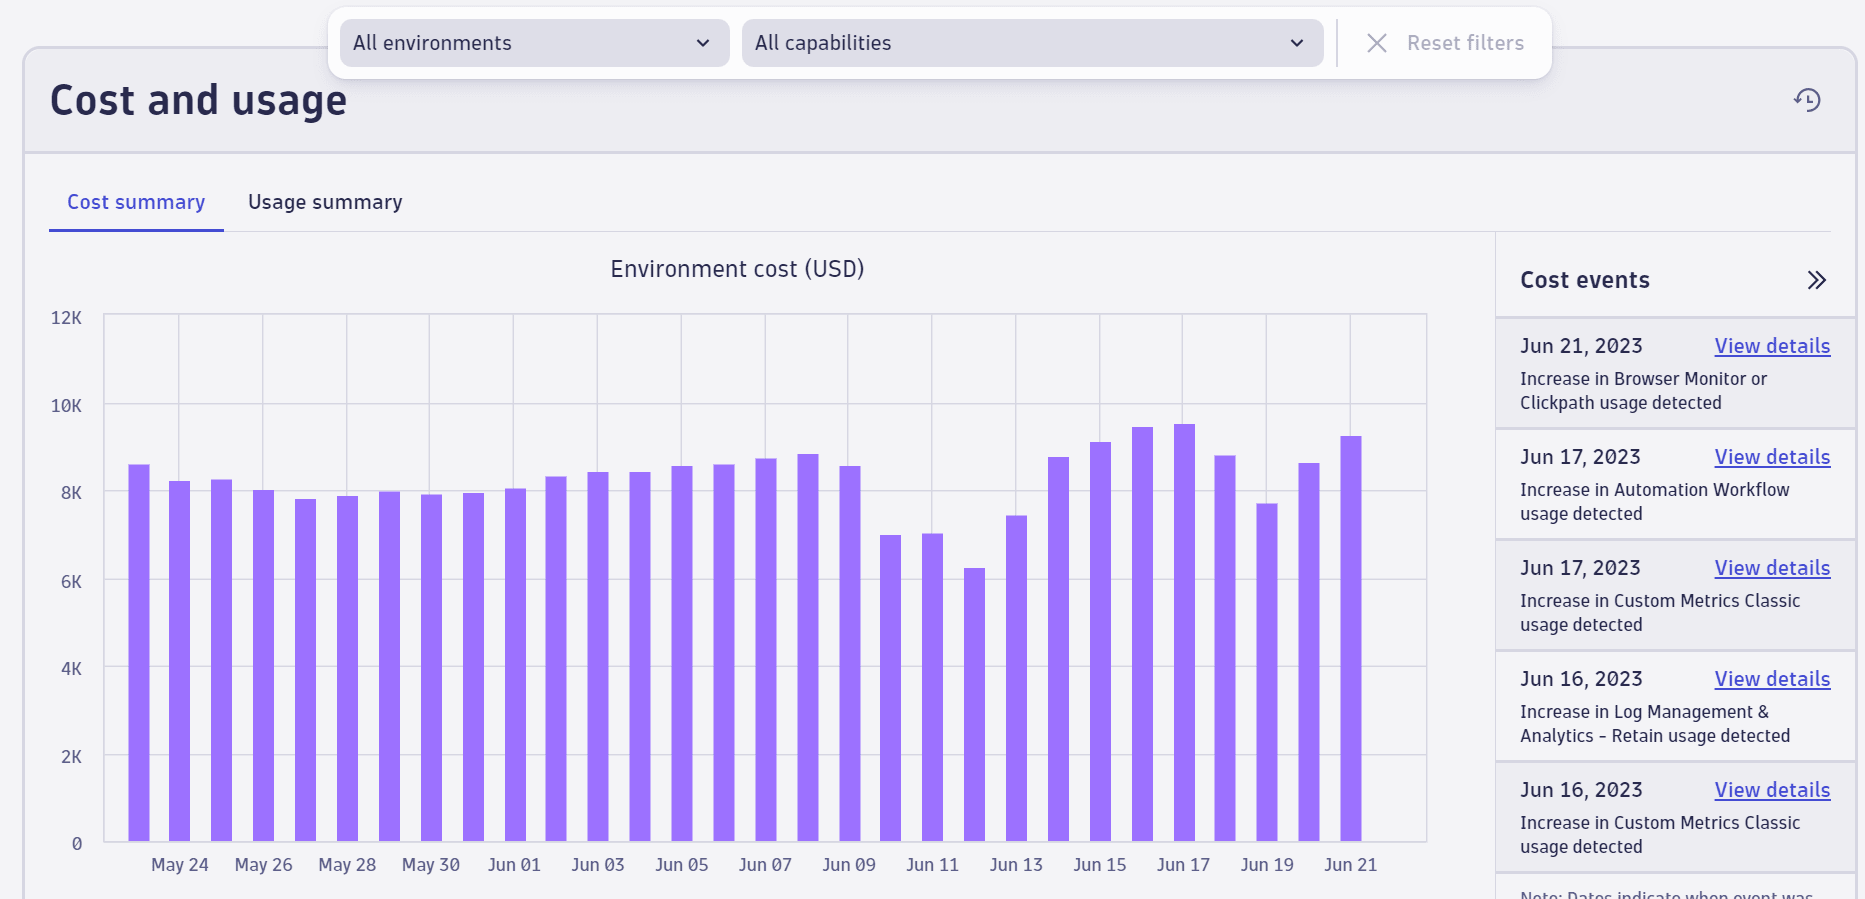
Avoid billing surprises with smart Dynatrace cost monitors
Dynatrace has introduced cost monitors to help customers manage their budget and maximize their use of the Dynatrace platform. These monitors notify users of any significant changes in costs during their subscription, allowing them to balance usage against their budget. The monitors use predictive AI and smart forecasting algorithms to project usage and costs, notifying users when forecasts exceed budget or unexpected spikes occur. They run in the background daily, automatically monitoring usage and costs, and notify administrators without manual setup. The monitors also track daily costs at the capability and environment levels, sending email notifications when costs exceed predicted levels. Dynatrace will continue to fine-tune the cost-event detection algorithms to improve accuracy. The cost monitors are already running for customers using the Dynatrace Platform Subscription model. Further details can be found in the documentation.
#DynatraceCostMonitors #MaximizeBudgetUsage #SmartForecasting #softcorpremium
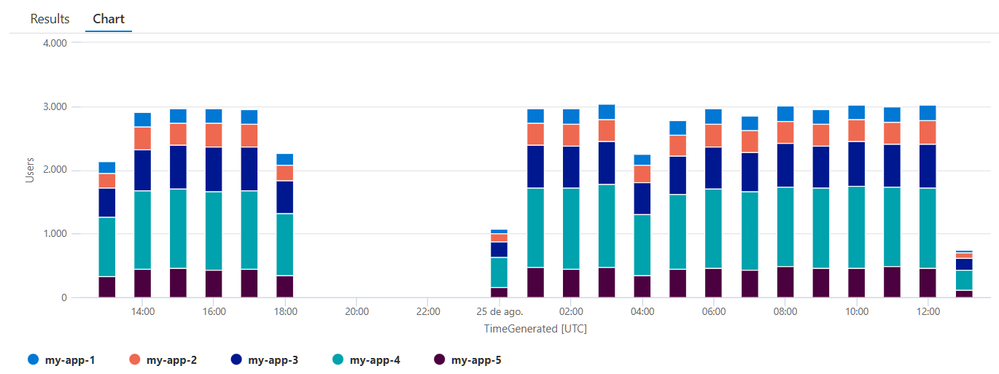
Plotting "unique users" charts from API Management logs - Microsoft Community Hub
The artical focuses on Azure API Management and explains how to identify unique users in the context of HTTP requests. The author suggests using JWT tokens sent by apps as a quick and reliable way to extract user information. The tutorial also covers configuring API Management to export logs, crafting a Kusto query to plot the chart, and important considerations regarding data privacy and compliance.
#AzureAPIM #DataAnalytics #TechTutorial #softcorpremium
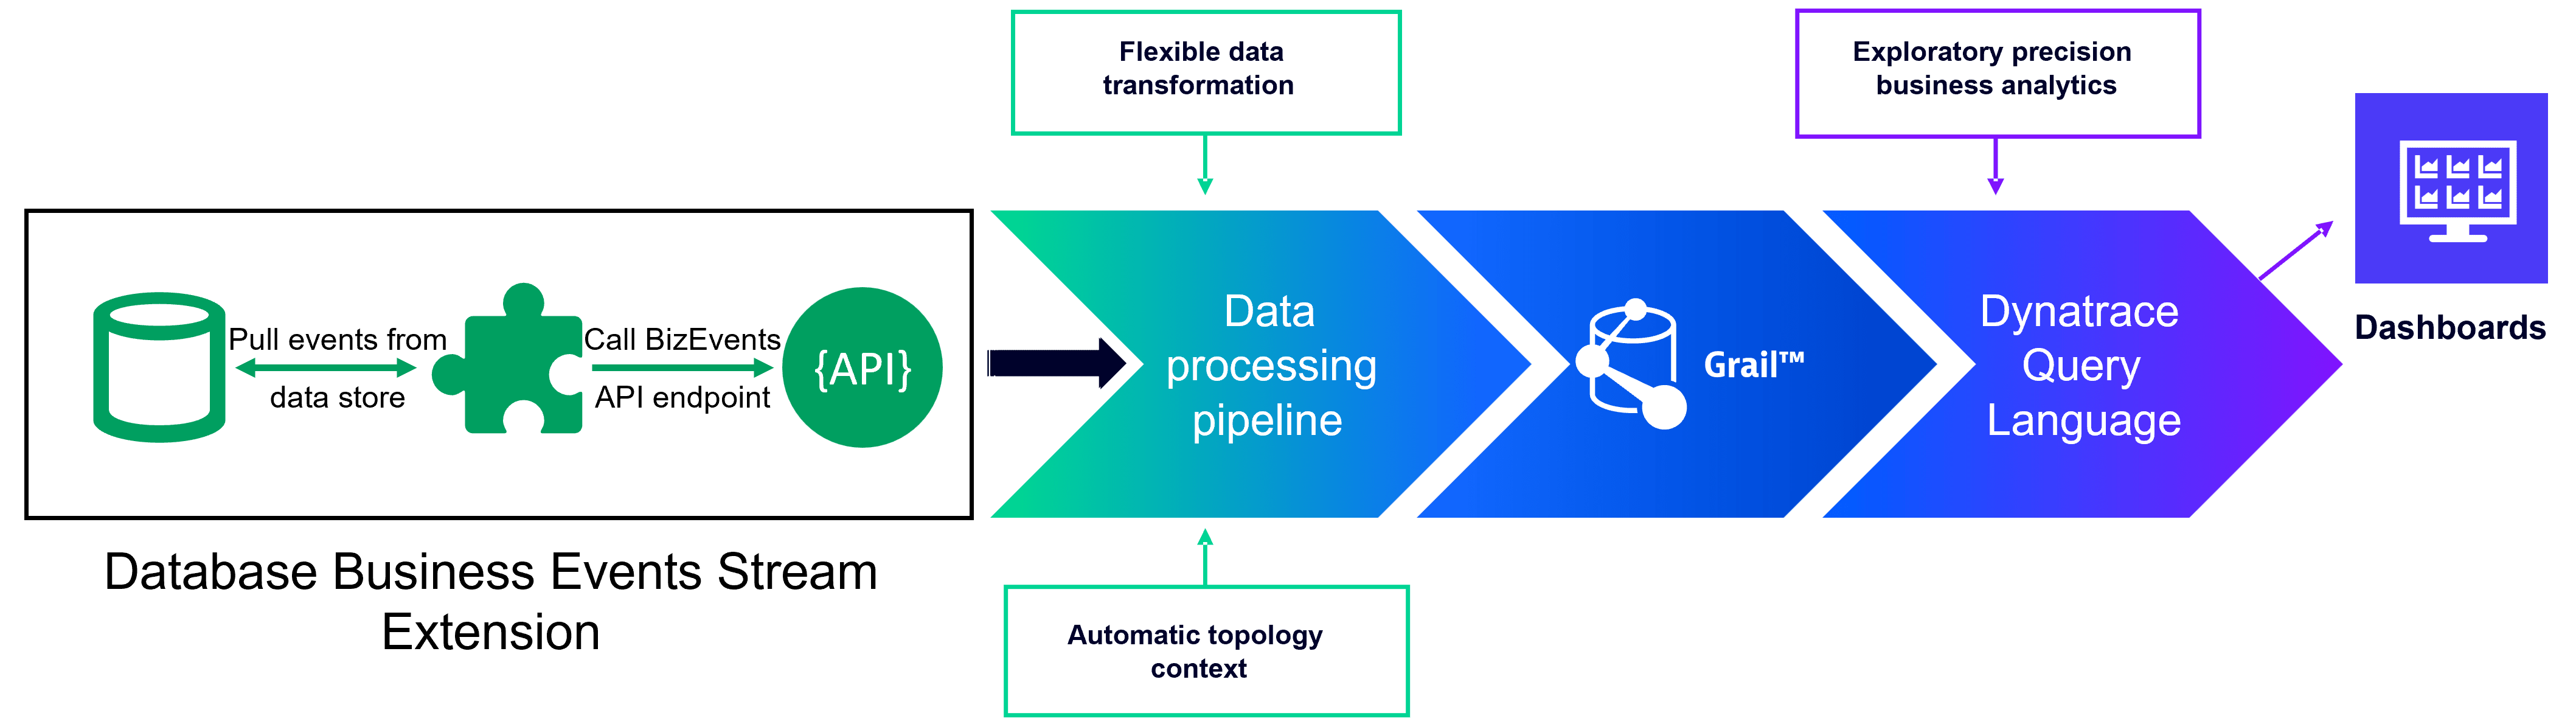
Extend business observability: Extract business events from online databases (Part 1)
Dynatrace has developed a solution called \"business events\" that provides real-time business observability to help business leaders make data-driven decisions and improve customer experiences. This solution addresses common challenges such as difficult data access, delayed data delivery, and lack of IT context in business intelligence tools. Dynatrace business events offer precise, real-time metrics that support fine-grained business decisions and auditable reporting. They also allow organizations to access and analyze large, long-term data sets without pre-indexing. By extending business observability to data at rest, Dynatrace enables comprehensive analysis and contextual understanding of business data. This solution goes beyond traditional business intelligence by capturing specific occurrences or actions, fostering collaboration among teams, and enabling targeted outreach and process automations. Business observability provides organizations with real-time insights into their operations, performance, and behavior, helping them identify patterns, trends, anomalies, and correlations across different business dimensions. It enables businesses to optimize their systems, enhance user experiences, streamline processes, and achieve their intended business objectives.
#RealTimeBusinessObservability #DataDrivenDecisions #BusinessIntelligence #softcorpremium
Amazon SageMaker announces preview of GPU/CPU profiler tooling for deep learning model development
Amazon SageMaker has announced the preview of its new tool called SageMaker Profiler, which offers advanced observability for large deep learning workloads. This tool provides granular insights into compute hardware performance, allowing users to optimize model training for computer vision, NLP, and foundation model use cases. It offers metrics, trace plots, custom annotations, and visibility into mixed precision utilization, enabling users to identify bottlenecks and uneven resource utilization. The SageMaker Profiler is efficient, scalable, and reduces overhead during training. It is currently available in select regions at no cost during the preview period.
#AmazonSageMaker #SageMakerProfiler #DeepLearningWorkloads #softcorpremium
Cisco AppDynamics GovAPM delivers FedRAMP authorized all-in-one visibility - Application Performance Monitoring Blog | AppDynamics
Government organizations are embracing innovative cloud strategies, and Cisco AppDynamics GovAPM is helping them efficiently manage applications and drive cloud adoption while maintaining high security standards. The solution is fully authorized and has maintained its FedRAMP (Moderate) Authorization to Operate (ATO) in a recent audit. Cisco AppDynamics GovAPM provides application performance monitoring insights, network visibility, infrastructure visibility, end user monitoring, browser real user monitoring, mobile real user monitoring, and cluster monitoring. These features help agencies identify and troubleshoot performance issues, optimize user experiences, and proactively alert the IT team about any deviations. Cisco AppDynamics is constantly innovating to help government organizations keep pace with new challenges and technologies.
#CloudStrategy #GovAPM #GovernmentInnovation #softcorpremium
What is behavior analytics?
Organizations are increasingly turning to behavior analytics tools to understand user experiences and maximize the value of customer data. By tracking and evaluating user behavior on websites and mobile apps, these analytics can identify what features users find interesting, where they encounter difficulties, and what motivates them to convert or abandon their sessions. Behavior analytics can help organizations improve their digital products and optimize the customer experience. Common behaviors tracked include clicks and taps, scrolling, and mouse movements. Analytics software is used to collect and analyze user behavior data, which can be segmented and compared to gain insights into specific parameters and customer journeys. Various tools, such as A/B testing, heatmaps, customer feedback, session replays, and real user monitoring, can be used to analyze behavior and improve the user experience. The benefits of behavior analytics include proactively identifying and resolving user experience issues, improving engagement, and aligning cross-functional teams. When choosing a behavior analytics solution, organizations should look for capabilities such as AI-driven root-cause analysis, end-to-end monitoring, and full contextual insight. Dynatrace is a platform that offers big data analytics and gap-free data to help organizations understand user behavior and improve their digital experiences.
#BehaviorAnalytics #UserExperience #DigitalOptimization #softcorpremium
Enabling Full-Stack Observability for Business Success - Orange Matter
McKinsey & Company has released a report explaining the concept of full-stack observability and how it can benefit businesses. This approach helps break down departmental silos, streamlines tools, optimizes observability for DevOps, and modernizes applications and databases. By adopting full-stack observability, businesses can shift their IT culture from reactive to proactive. #TechNews #Observability #DevOps
#TechNews #Observability #DevOps #softcorpremium
Monitoring machine learning models in production with Grafana and ClearML | Grafana Labs
Victor Sonck, Developer Advocate for ClearML, discusses the use of Grafana in ClearML Serving for monitoring machine learning models in production. ClearML is a toolbox of modules that helps data scientists deploy machine learning models more quickly. ClearML Serving integrates with Grafana and Prometheus to provide monitoring capabilities for model predictions and speed. It also supports canary deployments, automated deployment triggers, and centralized logging. Grafana is used to visualize and analyze serving metrics, including network and model latency. Custom alerts can be configured in Grafana to notify users of issues with production models. ClearML and Grafana offer a comprehensive solution for managing machine learning operations.
#machinelearningoperations #monitoringmetrics #canarydeployments #softcorpremium
Unify your observability signals with Grafana Cloud Profiles, now GA | Grafana Labs
Grafana has announced the availability of Grafana Cloud Profiles, which integrates continuous profiling with metrics, logs, and traces within its observability stack. This move challenges the traditional concept of observability as separate pillars and promotes a holistic, integrated view of system health and performance. Correlating profiles with other observability data allows for more efficient infrastructure optimization, debugging, and application performance improvement. The integration has been praised by fintech startup Alpaca and online food delivery platform Zomato for its ability to pinpoint and address complex production issues. Users can easily get started with Grafana Cloud Profiles by adding profiling to their application using the provided agent or the Grafana Agent.
#GrafanaCloudProfiles #ObservabilityIntegration #ApplicationPerformance #softcorpremium
How Qonto used Grafana Loki to build its network observability platform | Grafana Labs
French self-taught engineer Christophe, who specializes in site reliability engineering, shares his experience using Grafana Loki for network observability at Qonto, a fintech company. Qonto's goal is to provide an intuitive and reliable financial solution for small and medium-sized enterprises (SMEs) and freelancers. Christophe explains how they switched from using Elasticsearch for log ingestion and search to Grafana Loki, due to cost implications and storage costs. He provides an overview of their new architecture and how they explore and analyze logs using Grafana's Explore tab. Christophe also discusses how they produce metrics and alerts using Prometheus and AlertManager, and shares examples of helpful queries. The success they've had with VPC Flow Logs has encouraged them to expand this approach to other use cases, and they have contributed to the Lambda Promtail project to support ingesting logs from other AWS services.
#GrafanaLoki #SiteReliabilityEngineering #Qonto #softcorpremium
Amazon CloudWatch Agent adds support for OpenTelemetry traces and AWS X-Ray
Amazon CloudWatch Agent now supports OpenTelemetry traces and AWS X-Ray, allowing users to collect metrics, logs, and traces with a single agent. This simplifies the installation, configuration, and management of telemetry collection. Developers can now configure CloudWatch Agent to collect traces from both AWS X-Ray and OpenTelemetry instrumentation SDK and send them to AWS X-Ray without the need for a separate trace collection daemon. This integration provides a complete view of requests as they travel through the application, including other supported AWS services. Amazon CloudWatch Agent and AWS Distro for OpenTelemetry are available for free, while pricing details for CloudWatch and X-Ray can be found on their respective pricing pages.
#AmazonCloudWatchAgent #OpenTelemetry #AWSXRay #softcorpremium
Inside Grafana Labs’ hiring process for backend engineers | Grafana Labs
Grafana Labs, a tech company, has shared an in-depth guide for backend engineers interested in joining their team. The hiring process includes several stages, starting with a phone call with the tech recruitment team. Candidates will then go through interviews with hiring managers, coding exercises, and non-abstract system design discussions. It is important for candidates to showcase their problem-solving skills, communication abilities, and collaborative mindset. The company focuses on predicting a candidate's performance rather than relying solely on their interviewing abilities. The final stage involves reflecting on the interview experience and determining if the role and company are a good fit. If successful, candidates will receive an offer and have the opportunity to speak to other team members before making a decision. Grafana Labs is looking for smart, curious, and kind individuals to join their team.
#GrafanaLabsHiring #BackendEngineersWanted #JoinOurTeam #softcorpremium
Grafana 10.1 release: all the latest features
Grafana 10.1 has been released, bringing new features and improvements to enhance observability insights. The update includes an improved flame graph for better application performance analysis, a new geomap network layer for visualizing spatial distribution, simplified alerting workflows, and more. The flame graph now provides a comprehensive overview of symbols, customizable views, and enhanced navigation features. The geomap network layer simplifies the process of building network maps by allowing connections without sequential ordering or multiple layers. Disconnected values in dashboards improve data accuracy by preventing misleading connections. Span filtering helps pinpoint specific spans of interest in trace analysis, while TraceQL response streaming improves query efficiency. The update also distinguishes between visualization panels and widgets for better dashboard creation, and introduces a new alert rule creation workflow for easier management. Grafana 10.1 is available for download now.
#GrafanaUpdates #ObservabilityEnhancements #DataVisualization #softcorpremium
Cut through the complexity of your public sector cloud migration - Application Performance Monitoring Blog | AppDynamics
Public sector agencies are increasingly migrating their applications to the cloud, but they are facing challenges related to visibility and insight into their technology environments. Cisco AppDynamics aims to address these concerns by providing full visibility into application performance throughout the cloud migration process. The platform helps agencies understand their current application landscape, make smarter migration decisions, and optimize applications once they are in the cloud. It also enables agencies to track their success and hold cloud providers accountable. With Cisco AppDynamics, public sector agencies can confidently migrate their mission-critical applications to the cloud with improved visibility and intelligence.
#cloudmigrationchallenges #applicationperformance #softcorpremium